Cyberthon 2020 Writeup
My first CTF with data science challenges

Contents
Overview
Team Name: acsi-1 (itzybitzyspider)
Position: 3
Score: 6856
Other Awards: Top in Data Science Category
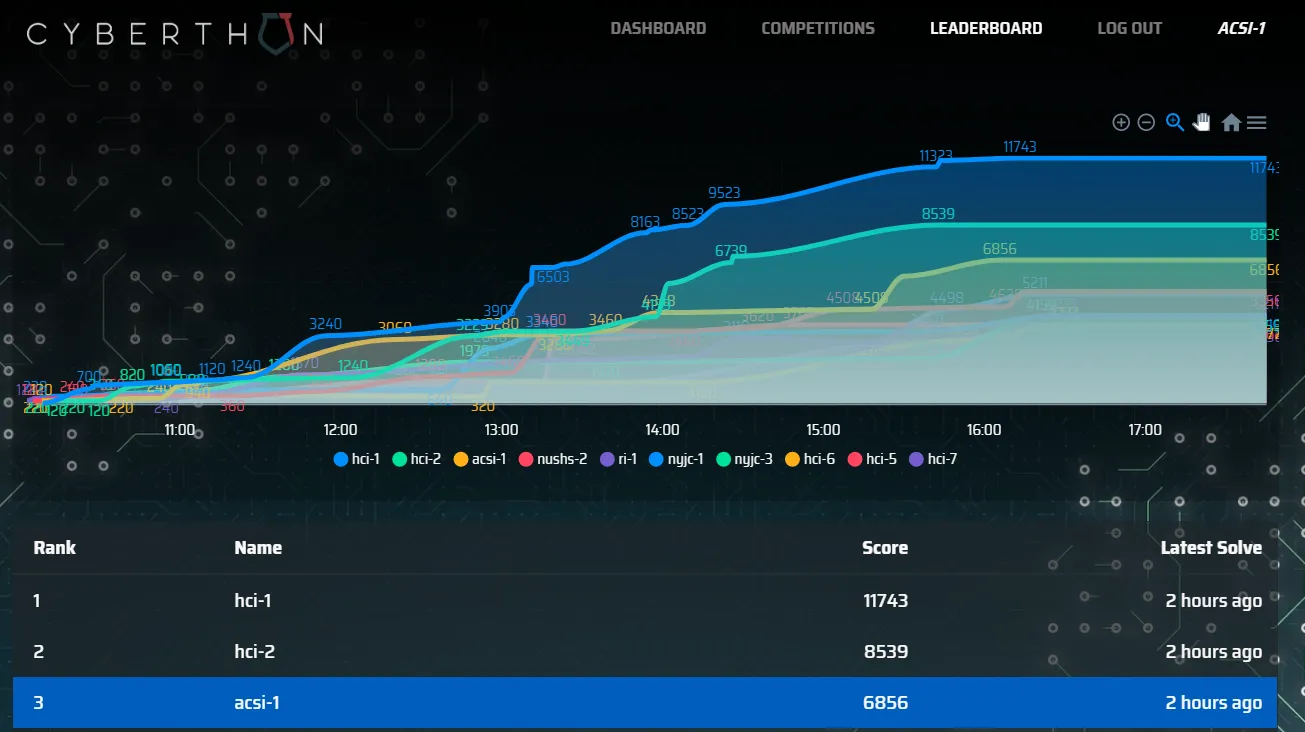
Participated in the 2nd Cyberthon held by HCI and CSIT. Definitely performed better than last year. Do check out the writeups by my teammates @oceankoh and @NyxTo. Also, please check out the HCI geniuses’ writeups too! Felt honoured to compete against them.
Heart Paint
Points: 888
Solves: 4
A robot was entrusted to send a message to other CSIT engineers, the robot was smart enough to protect the message.
The attackers in attempts to reveal the message, tampered with the robot through various means.
Though the attempt was unsuccessful, the robot evolved into 9 different personalities (as a form of defensive mechanism).
Can you find out what was the message that was entrusted to the robot?
Run the ELF 9 times and answer the questions using common sense to get 9 different images. The 9 images piece together to form the phrase Secret is sealed within and an image of a zip file.

Using foremost on all 9 images, we get 9 zip files with text files inside. We notice that the text from image A has the following first line image - a very big clue. From experience, we know this is a base64 image. We can concatenate all the text in each image from A-I, in that order, excluding the first line of text from image A. This would give us a huge base64 image string. Most people would just use the terminal to cast the entire base64 into a file. Being lazy to debug things, I threw it into an online base64 to image converter.

Spot the Malicious Users
Not a challenges I’m proud of the process, but I’m proud with the clutch result.
Points: 768/800 (95.99% prediction accuracy)
Description:
There have been suspicious activity detected by certain users of the ShoppingBaba Website. Your task is to predict which users are malicious attackers and which are innocent!
You are provided with 2 datasets: global_internet_users_activity.csv (trainset) and shopping_baba_users_activity.csv (testset). Use the features, CPU usage, Memory Usage and Running Time, to create rules that can accurately predict which are malicious (1) or normal users (0) in the trainset by checking against the groundtruth. Then use the rules you have created to make predictions on the testset.
Predictions to be submitted in a csv format. Header of the prediction column should be named ‘Prediction’. Innocent users to be labelled as 1 while malicious users labelled as 0. The csv should be named ‘prediction.csv’.
A note on this challenge: Although this was not the highest scoring data science challenge, it was the deterministic one. The remaining challenges were possible to full solve, hence, this was the only one where the score was basically volatile.
Exploratory Data Analysis (EDA)
The description tells us it’s a binary classification challenge, seems fairly simple. Looking through train.csv we realise that theres only 3 predictors: CPU Usage, Memory Usage and Running Time.
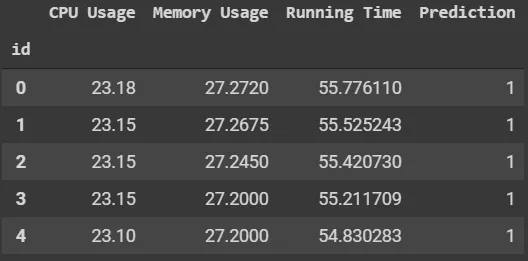
Running train.isnull().sum().plot.bar() tells us that there are no null values - Perfect! Furthermore, none of the values were skewed when using train['Running Time'].skew() to check. There were also no outliers outside z-score >= 3.5. In other words, there was no cleaning required. There was also not really any feature engineering to do with the limited dataset, so we can use our datasets as is.
XGBoost
After some trial and error, the following XGBClassifier hyper parameters were chosen. The results weren’t phenomenal, but they were decent
xgbClf = XGBClassifier(
    tree_method='gpu_hist',
    max_depth=5,
    min_child_weight=1,
    objective = 'binary:logistic',
    learning_rate=0.002,
    n_estimators=8000,
)
x0, x1, y0, y1 = train_test_split(X, y, test_size=0.1, random_state=2002)
xgbClf.fit(X, y, eval_set=[(x1, y1)], early_stopping_rounds=1000, verbose=500)
pd.DataFrame({indexColName:test.index,yColName:xgbClf.predict(test)}).to_csv(fsPre+'submission-xgb.csv',index=False)
When submitted to the online judges, it yielded a pretty satisfying 90.99%. The steps up to here took about 15 mins. Over the course of the competition, I would spend another 1 hour testing other models on the online judge to no avail. Of course, I also had to spend time on other challenges, the next thing I knew, we had 30 mins left and 13/20 submissions remaining. The highscore then was 94.66%
The Important Part
I was completely bamboozled with no idea how to get a better score. I decided to open each file. Lo and behold! I noticed something. In train.csv we see a chunk of 1s, then 0s, then 1s, then 0s.

Hmm… suspicious. Let’s take a look at our prediction.

Hmm… even more suspicious. We notice these are very huge chunks and probably whoever made the dataset did not write a script to randomize the order and all that. So, let’s exploit this human vulnerability. We first do a very important thing - ensure each chunk is consistent (a chunk of 1s should only have 1s and a chunk of 0s should only have 0s). Since there were only 2664 predictions, we could do this manually. The image below shows an example of the values to invert in yellow.
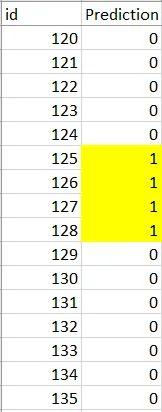
This would improve results by about 1.5%.
What’s next? We can exploit this flaw even more. Assuming you were the one to do this task of merging the 0s and 1s. What would you have done? Perhaps, you had 2 files, one with the 0s and one with the 1s. You would pick an index and copy a specific number from the 1s file, do the same thing on for the 0s file and carry on this process. But then you also need to remember the index, so ideally, you would pick nicer numbers. What are nice numbers? Perhaps anything that is a multiple of 100.
We can change the boundaries to the 100 index marks as humans like nice numbers. For example if prediction 0-304 are 1s and prediction 305-500 are 0s, we can just change prediction 301-304 to 0s too.
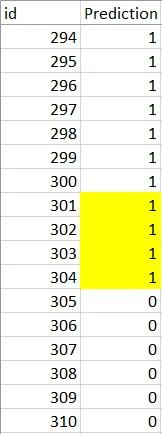
This increased our results to about 93% - decently close to the top prediction.
Since we are about 200 predictions off, we can further this observation by pushing the boundaries by 100s. By guessing our remaining 8 attempts, we got to our very desired 95.99%. Of course, this would not have been possible without the 90% initial prediction.
The Most Important Part
This is definitely NOT the way to solve a data science challenge. The only reason I did this was because it was a CTF so “exploiting” these kinds of patterns was within the rules of the competition. In a standard data science competition, we are most definitely not allowed to find these kinds of trends, though there should be none to begin with.
Looking back on my machine learning model and other competitor’s models, perhaps I should’ve tried more hyperparameters especially because I did not have a solid classification template. I guess that’s something I need to work on before my next data science related competition.
Parsing Events
Points: 2000/2000
We found a network event log that the attackers forgot to delete. The logs are in a strange format though. We have a few questions that we want to find the answers to - can you help us?
Note: Your answers should be a text file with each answer on a separate line. Messages should have the outer “ removed. Leave blank lines for questions that you are not answering.
Example:
Logs:
Bob sent “Hi!” to Alice at 4.30pm.
At 3.50am, “Welcome!” was sent to Charlie by Alice.Questions:
What did Charlie send to Alice at 3.50am?
Who sent “Hi!”?Answers:
Welcome!
BobANSWERS HAVE A FORMAT A SINGLE COLUMN CSV FILE WITH HEADER “answer”
Not a challenge that I solved, but was amazed by NyxTo’s elegant regex so here is his code:
import re, pandas as pd

logs, qns = open('logs.txt').read().strip().split('\n'), open('questions.txt').read().strip().split('\n')

msgs, dts, sndrs, rcpnts = [], [], [], []
msg_re = re.compile(r'"[^"]+"')
dt_re = re.compile(r'\d{4}\-\d{2}\-\d{2} \d{2}:\d{2}:\d{2}')
sndr_re = re.compile(r'[0-9a-f]{1,4}(:[0-9a-f]{1,4}){7} sent | by [0-9a-f]{1,4}(:[0-9a-f]{1,4}){7}')
rcpnt_re = re.compile(r'[0-9a-f]{1,4}(:[0-9a-f]{1,4}){7} was sent | to [0-9a-f]{1,4}(:[0-9a-f]{1,4}){7}')

for line in logs: # 100,000
    msgs.append(msg_re.search(line).group(0))
    dts.append(dt_re.search(line).group(0))
    sndr, rcpnt = sndr_re.search(line).group(0), rcpnt_re.search(line).group(0)
    sndrs.append(sndr[4:] if sndr[0]==' ' else sndr[:-6]) # just user address, chop off surrounding excess
    rcpnts.append(rcpnt[4:] if rcpnt[0]==' ' else rcpnt[:-10]) # just user address, chop off surrounding excess

ans = []
usr_re = re.compile(r'[0-9a-f]{1,4}(:[0-9a-f]{1,4}){7}')
t1_re = re.compile(r'Who sent "[^"]+"')
t2_re = re.compile(r'Who did [0-9a-f]{1,4}(:[0-9a-f]{1,4}){7} send "[^"]+"')
t3_re = re.compile(r'What did [0-9a-f]{1,4}(:[0-9a-f]{1,4}){7} send at \d{4}\-\d{2}\-\d{2} \d{2}:\d{2}:\d{2}')
t4_re = re.compile(r'Who did [0-9a-f]{1,4}(:[0-9a-f]{1,4}){7} receive a message from at \d{4}\-\d{2}\-\d{2} \d{2}:\d{2}:\d{2}')

for line in qns: # 5000 * 100,000
    if t1_re.match(line):
        msg = msg_re.search(line).group(0)
        for i in range(0, len(logs)):
            if msgs[i] == msg:
                ans.append(sndrs[i])
                break
    elif t2_re.match(line):
        sndr, msg = usr_re.search(line).group(0), msg_re.search(line).group(0)
        for i in range(0, len(logs)):
            if sndrs[i] == sndr and msgs[i] == msg:
                ans.append(rcpnts[i])
                break
    elif t3_re.match(line):
        sndr, dt = usr_re.search(line).group(0), dt_re.search(line).group(0)
        for i in range(0, len(logs)):
            if sndrs[i] == sndr and dts[i] == dt:
                ans.append(msgs[i][1:-1]) # chop off quotes
                break
    elif t4_re.match(line):
        rcpnt, dt = usr_re.search(line).group(0), dt_re.search(line).group(0)
        for i in range(0, len(logs)):
            if rcpnts[i] == rcpnt and dts[i] == dt:
                ans.append(sndrs[i])
                break

pd.DataFrame({'answer':ans}).to_csv('ans.csv', index = False)
Original writeup can be found in NyxTo’s GitHub Repo